Pay per GB, not per host
One price for the data you send, with no fee per server, container or agent. Fifty servers sending 300 GB a month cost $56.50 a month on Pro.
How the pricing compares →Observability platform · OpenTelemetry native
Televane brings metrics, logs, traces and alerts together, so your team finds the cause of a problem in minutes instead of hours. Install the agent with one command and see your first data right away.
See it in action
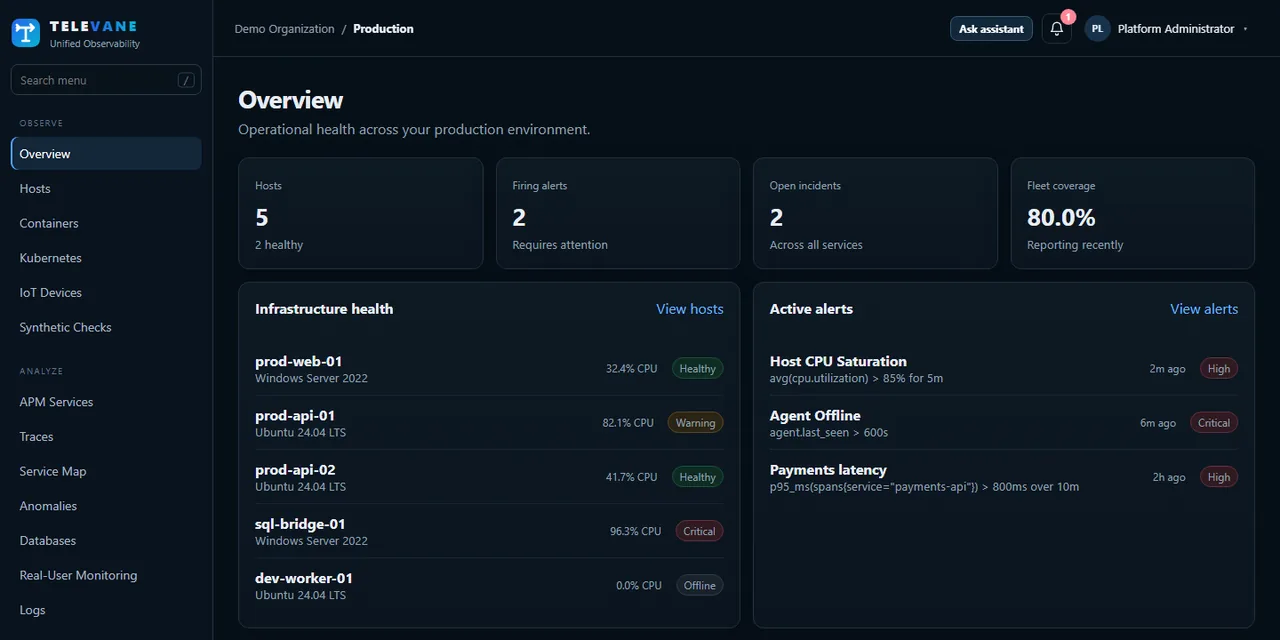
These are real screens from the Televane portal, shown with demo data.
Follow every request from the front end through your services to the database and the external APIs it calls. The map is built from OpenTelemetry traces, so slow and failing dependencies stand out without drawing anything by hand.
APM and distributed tracing →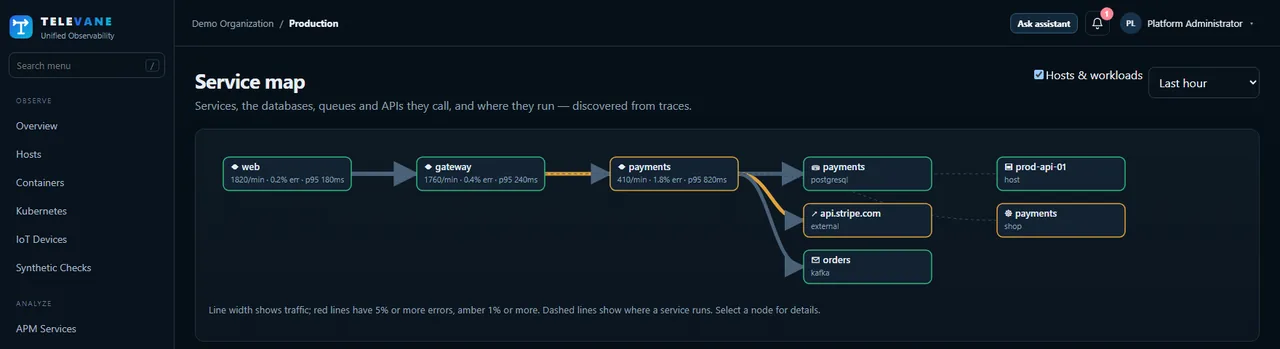
CPU, memory, disk and the busiest processes for every server, refreshed every 15 seconds. The agent installs with one command, connects outbound only and caps its own CPU and memory, so it is safe on production machines.
Windows Server monitoring →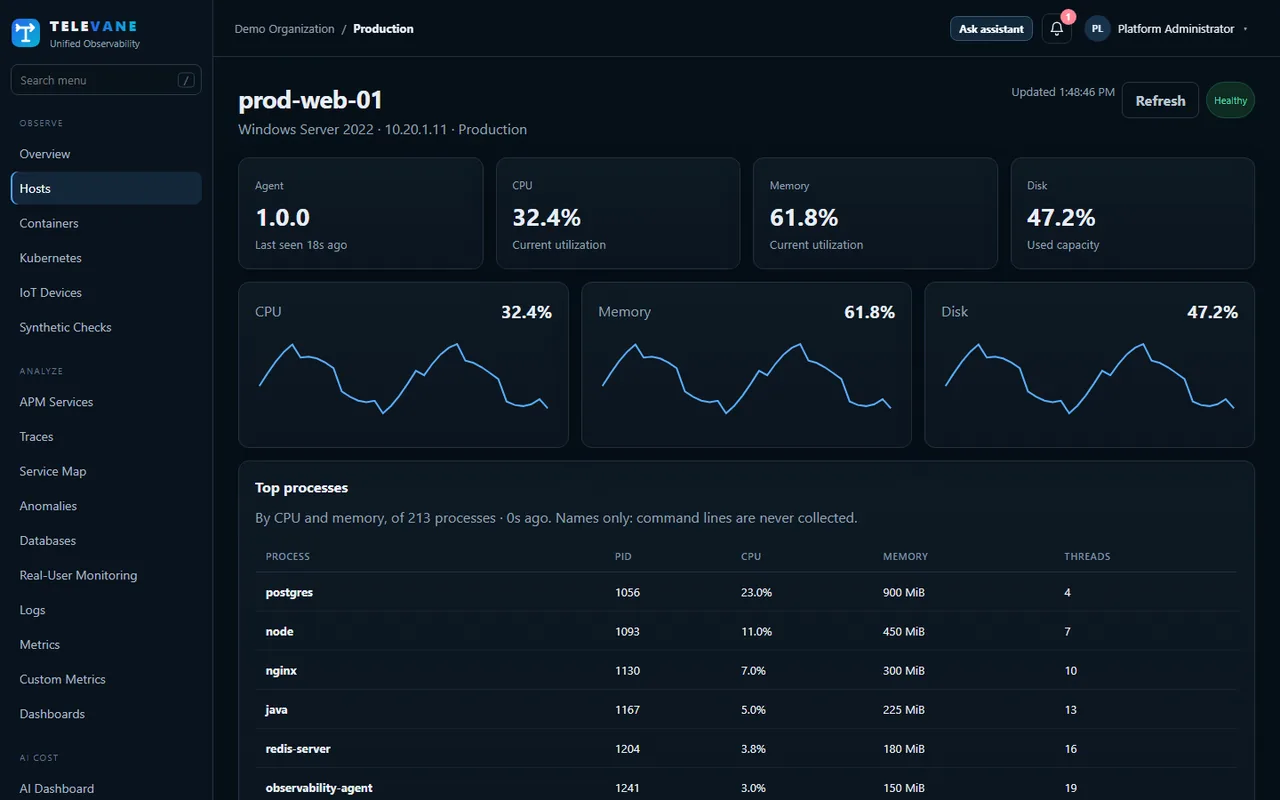
See what AI features cost by provider, model, team and user, with a month-end forecast and budgets that warn before spend runs away. Route OpenAI and Anthropic calls through one gateway to apply your rules.
LLM observability →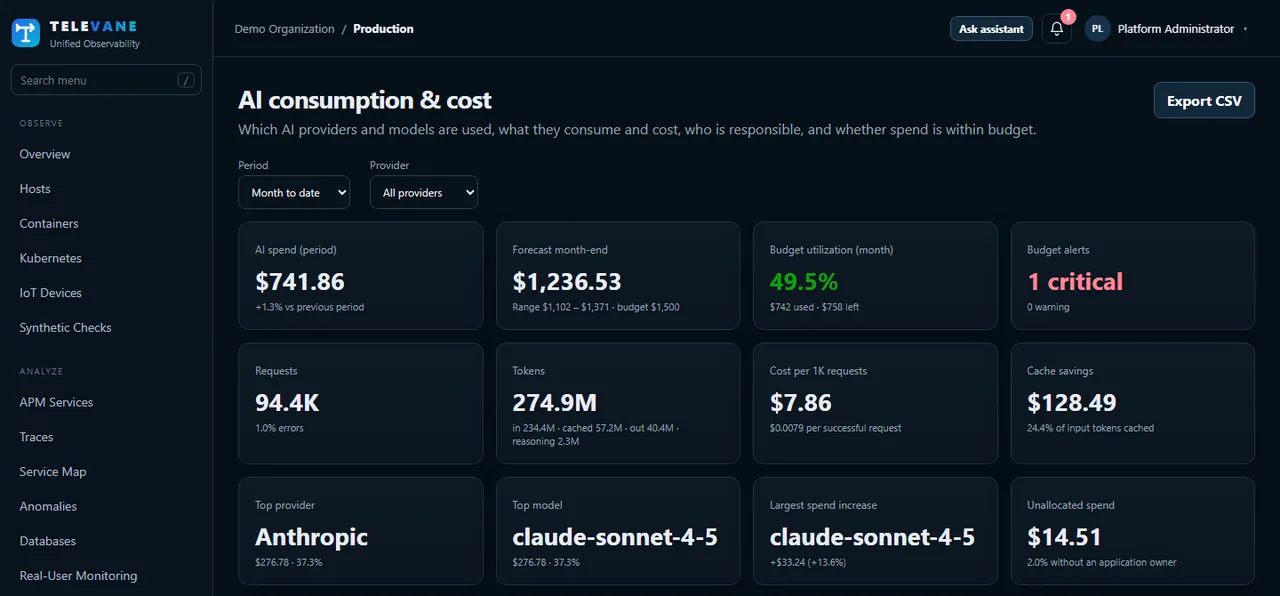
Check websites, APIs, ports and DNS around the clock and get warned days before a TLS certificate expires. Run checks from Televane, or from inside your own network for internal systems.
Synthetic and uptime monitoring →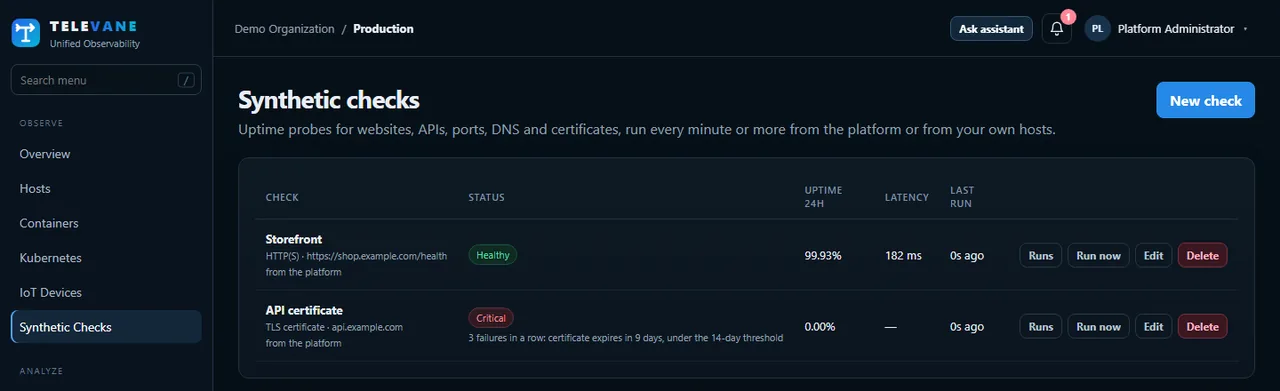
Why teams switch
One price for the data you send, with no fee per server, container or agent. Fifty servers sending 300 GB a month cost $56.50 a month on Pro.
How the pricing compares →Televane is an OpenTelemetry backend: instrument once with the open standard and keep that work if you ever move. No proprietary agent in your code.
OpenTelemetry backend →A read-only pre-check before every install, hard limits on the agent's CPU and memory, and a one-command removal that leaves the server exactly as it was.
Getting started →Product
One platform instead of five tools, with higher limits as you grow.
CPU, memory, disk and network for Windows and Linux servers, top processes, containers and Kubernetes clusters.
Learn more →Follow a request across services with OpenTelemetry traces, a live service map and latency and error breakdowns.
Learn more →Search logs from files, the Windows Event Log and journald, linked to the traces and hosts they came from. Secrets are masked before they leave your server.
Learn more →Alert rules, SLOs with burn-rate alerts, anomaly detection, on-call schedules and related alerts grouped into one incident.
Learn more →Test websites, APIs, ports, DNS and certificate expiry from outside — or from inside your own network with the agent.
Learn more →Connections, locks, slow and top queries and replication lag for PostgreSQL, MySQL and MariaDB.
Learn more →See what your AI features cost per model, team and user, set budgets, and route LLM traffic through one controlled gateway.
Learn more →When something breaks, Televane gathers the related alerts, logs and changes and suggests a likely cause for your team to check.
Learn more →Collect device readings from MQTT brokers on small gateways, with buffering for slow or unreliable links.
Learn more →How it works
Sign up with your work email. Your organization starts with a free 14-day Pro trial.
Copy one command from Add data and run it on your server — PowerShell on Windows, a shell on Linux. It installs a service and connects securely.
Hosts, metrics and logs appear within a minute or two. Add alerts, dashboards and OpenTelemetry traces from your applications.
$ErrorActionPreference='Stop'; ... Invoke-WebRequest "https://portal.televane.com/downloads/televane-agent-windows-$a.zip" ...
powershell -File "$d\install.ps1" -Server https://ingest.televane.com -EnrollToken enr_••••••••
Security
Your telemetry describes your systems, so we protect it like it matters.
Pricing
Pay for the data you send. Prices exclude GST. Save 10% when you pay yearly.
For personal projects and evaluation.
₹0forever
Most popular
For growing teams.
₹1,499/ month · $19
For companies with compliance needs.
₹24,999/ month · $299
For large organizations.
Customyearly agreement
FAQ
Your organization moves to the Free plan automatically. Nothing is charged, and you can choose a paid plan at any time under Plans & Pricing.
Windows Server 2016 and later, Windows 10/11, and Linux (x64 and ARM, including Raspberry Pi), Kubernetes clusters, PostgreSQL, MySQL and MariaDB, and any application instrumented with OpenTelemetry.
No. The agent only connects out to Televane over HTTPS (port 443). It opens no listening ports on your servers.
On Amazon Web Services in Mumbai, India, encrypted at rest and in transit, with encrypted backups in the same region.
By the gigabytes of data you send each month. There is no charge per host, container or user beyond each plan's user limit.
In India by card, UPI or net banking, with a GST invoice. Elsewhere by card. Plans can be paid monthly, or yearly with 10% off.
Create your account, install the agent and see your first data — free for 14 days on Pro, then free forever on the Free plan.
Create your free account